


Core Lithium Stock CXO.AX
Price
Core Lithium stock price
Details
Price
ⓘOverview
The Quote Chart provides detailed and dynamic insights into the Core Lithium stock's performance, showcasing daily, weekly, or monthly aggregated quotes. Users can switch between different time frames to analyze the stock's progression meticulously and make informed investment decisions.
Intraday Feature
The intraday feature provides real-time data, allowing investors to view the Core Lithium stock’s price fluctuations within the trading day, facilitating timely and strategic investment decisions.
Total Return and Relative Price Change
View the total return of the Core Lithium stock to gauge its profitability over time. The relative price change, based on the first quote available in the selected timeframe, offers insights into the stock’s performance, assisting in evaluating its investment potential.
Interpretation and Investment
Utilize the comprehensive data presented in the Quote Chart to analyze Core Lithium's market trends, price movements, and potential returns. Make informed investment choices by comparing different time frames and evaluating intraday data for optimized portfolio management.
| Date | Core Lithium Price |
|---|---|
| 2/20/2026 | 0.21 AUD |
| 2/19/2026 | 0.21 AUD |
| 2/18/2026 | 0.21 AUD |
| 2/17/2026 | 0.20 AUD |
| 2/16/2026 | 0.21 AUD |
| 2/13/2026 | 0.20 AUD |
| 2/12/2026 | 0.21 AUD |
| 2/11/2026 | 0.22 AUD |
| 2/10/2026 | 0.21 AUD |
| 2/9/2026 | 0.21 AUD |
| 2/6/2026 | 0.21 AUD |
| 2/5/2026 | 0.22 AUD |
| 2/4/2026 | 0.24 AUD |
| 2/3/2026 | 0.24 AUD |
| 2/2/2026 | 0.23 AUD |
| 1/30/2026 | 0.24 AUD |
| 1/29/2026 | 0.26 AUD |
| 1/28/2026 | 0.27 AUD |
| 1/27/2026 | 0.28 AUD |
| 1/23/2026 | 0.29 AUD |
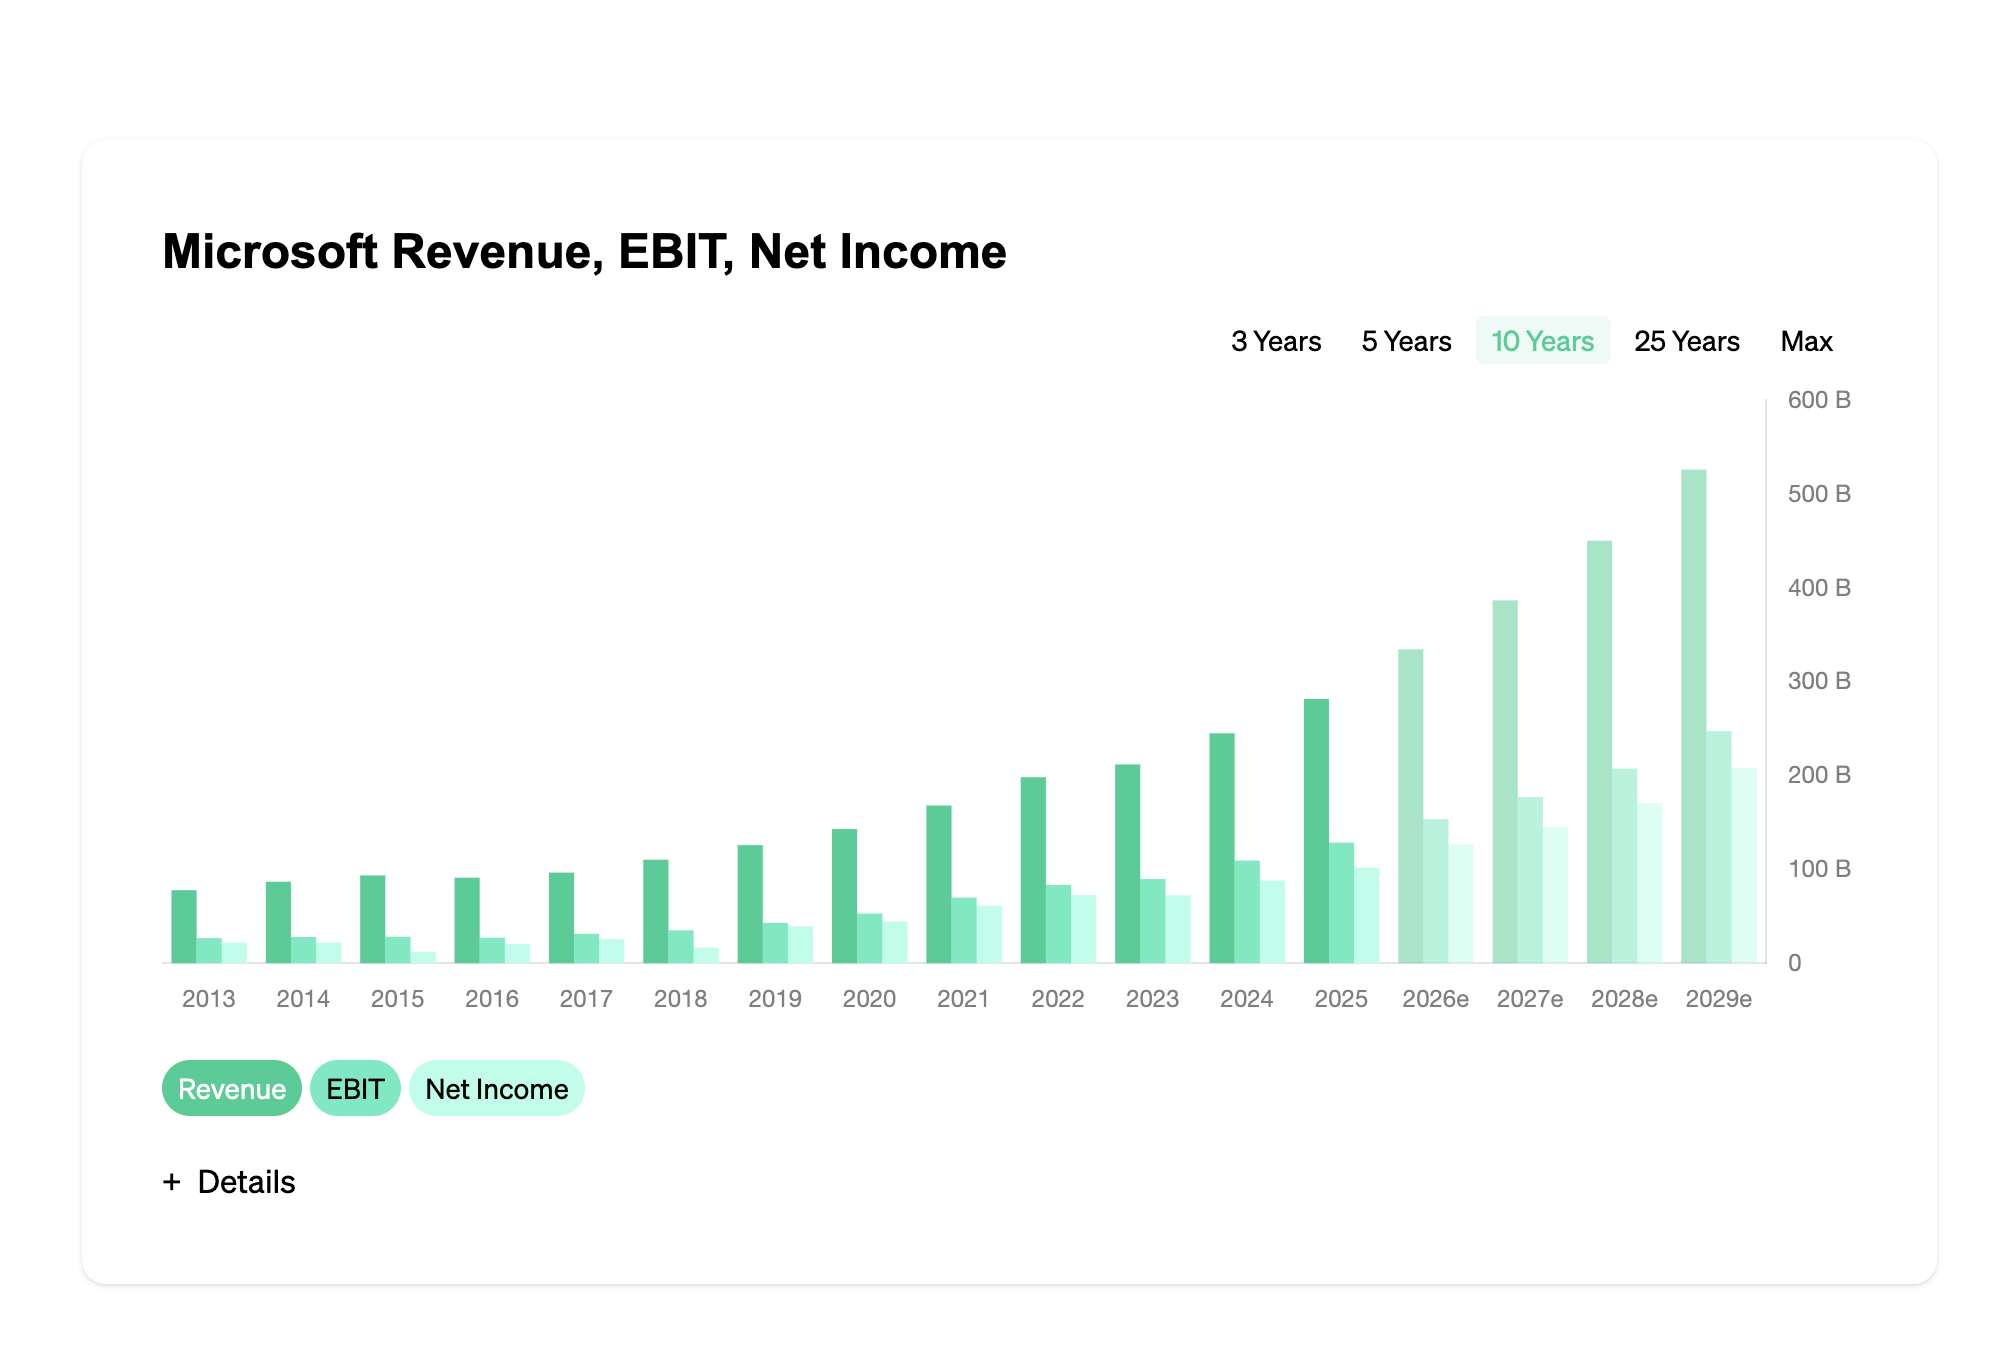
Core Lithium Revenue, EBIT, Net Income
3 Years
5 Years
10 Years
25 Years
Max
Details
Core Lithium Income Statement, Balance Sheet, Cash Flow Statement
| REVENUE (M AUD) |
|---|
| REVENUE GROWTH (%) |
| GROSS MARGIN (%) |
| GROSS INCOME (M AUD) |
| NET INCOME (M AUD) |
| NET INCOME GROWTH (%) |
| SHARES (B) |
| DOCUMENTS |
| 2010 | 2011 | 2012 | 2013 | 2014 | 2015 | 2016 | 2017 | 2018 | 2019 | 2020 | 2021 | 2022 | 2023 | 2024 | 2025 | 2026e | 2027e | 2028e | 2029e | 2030e |
|---|---|---|---|---|---|---|---|---|---|---|---|---|---|---|---|---|---|---|---|---|
| 0 | 0 | 0 | 0 | 0 | 0 | 0 | 0 | 0 | 0 | 0 | 0 | 0 | 50 | 189 | -2 | 6 | 295 | 282 | 292 | 345 |
| – | – | – | – | – | – | – | – | – | – | – | – | – | – | 278.00 | -101.06 | -400.00 | 4,816.67 | -4.41 | 3.55 | 18.15 |
| – | – | – | – | – | – | – | – | – | – | – | – | – | 56.00 | -13.23 | 1,250.00 | -416.67 | -8.47 | -8.87 | -8.56 | -7.25 |
| 0 | 0 | 0 | 0 | 0 | 0 | 0 | 0 | 0 | 0 | 0 | 0 | 0 | 28 | -25 | 0 | 0 | 0 | 0 | 0 | 0 |
| 0 | 0 | -1 | -1 | -1 | -1 | -1 | -1 | -2 | -2 | -4 | -2 | -7 | 10 | -207 | -23 | -6 | 81 | 0 | 43 | 2 |
| – | – | – | – | – | – | – | – | 100.00 | – | 100.00 | -50.00 | 250.00 | -242.86 | -2,170.00 | -88.89 | -73.91 | -1,450.00 | – | – | -95.35 |
| 0.04 | 0.03 | 0.05 | 0.05 | 0.09 | 0.14 | 0.2 | 0.34 | 0.49 | 0.67 | 0.8 | 1.06 | 1.58 | 1.82 | 2.09 | 2.14 | 0 | 0 | 0 | 0 | 0 |
| – | – | – | – | – | – | – | – | – | – | – | – | – | – | – | – | – | – | – | – | – |
Details
Keystats
ⓘRevenue and Growth
The Core Lithium Revenue and Revenue Growth are pivotal to understanding the company's financial health and operational efficiency. A consistent increase in revenue indicates a company’s ability to effectively market and sell its products or services, while the revenue growth percentage offers insights into the pace at which the company is expanding over the years.
Gross Margin
The Gross Margin is a crucial metric that showcases the percentage of revenue exceeding the cost of goods sold (COGS). A higher gross margin is indicative of a company’s efficiency in controlling its production costs, thereby promising potential profitability and financial stability.
EBIT and EBIT Margin
EBIT (Earnings Before Interest and Taxes) and EBIT Margin offer deep insights into a company’s profitability, excluding the impacts of interest and taxes. Investors often assess these metrics to gauge the operational efficiency and inherent profitability of a business, separate from its financial structure and tax environment.
Income and Growth
Net Income and its subsequent growth are quintessential for investors looking to understand a company’s profitability. Consistent income growth underscores a company’s ability to enhance its profitability over time, reflecting operational efficiency, strategic competitiveness, and financial health.
Shares Outstanding
Shares outstanding refer to the total number of shares a company has issued. It's instrumental in calculating key metrics like Earnings Per Share (EPS) which is pivotal for investors to evaluate a company’s profitability on a per-share basis, offering a more granular view of financial health and valuation.
Interpreting Year to Year Comparison
Comparing yearly data allows investors to identify trends, assess the company’s growth, and anticipate potential future performance. Analyzing how metrics like revenue, income, and margins change year over year can provide valuable insights into the company’s operational efficiency, competitiveness, and overall financial health.
Expectations and Predictions
Investors often juxtapose the current and past financial data with the market’s expectations. This comparison aids in assessing whether the Core Lithium is performing as anticipated, underperforming or outperforming the market predictions, providing pivotal data for investment decisions.
Core Lithium Stock Quarterly Figures
| REVENUE (M AUD) |
|---|
| REVENUE GROWTH (%) |
| GROSS MARGIN (%) |
| GROSS INCOME (M AUD) |
| NET INCOME (M AUD) |
| NET INCOME GROWTH (%) |
| SHARES (B) |
| 2011 Q4 | 2012 Q2 | 2012 Q4 | 2013 Q2 | 2013 Q4 | 2014 Q2 | 2014 Q4 | 2015 Q2 | 2015 Q4 | 2016 Q2 | 2016 Q4 | 2017 Q2 | 2017 Q4 | 2018 Q2 | 2018 Q4 | 2019 Q2 | 2019 Q4 | 2020 Q2 | 2020 Q4 | 2021 Q2 | 2021 Q4 | 2022 Q2 | 2022 Q4 | 2023 Q1 | 2023 Q2 | 2023 Q3 | 2023 Q4 | 2024 Q2 | 2024 Q4 | 2025 Q2 | 2025 Q4 |
|---|---|---|---|---|---|---|---|---|---|---|---|---|---|---|---|---|---|---|---|---|---|---|---|---|---|---|---|---|---|---|
| 0 | 0 | 0 | 0 | 0 | 0 | 0 | 0 | 0 | 0 | 0 | 0 | 0 | 0 | 0 | 0 | 0 | 0 | 0 | 0 | 0 | 0 | 0 | 0 | 0 | 25 | 50 | 134 | 54 | -2 | 0 |
| – | – | – | – | – | – | – | – | – | – | – | – | – | – | – | – | – | – | – | – | – | – | – | – | – | – | 100.00 | 168.00 | -59.70 | -103.70 | – |
| – | – | – | – | – | – | – | – | – | – | – | – | – | – | – | – | – | – | – | – | – | – | – | – | – | 60.00 | 68.00 | -0.75 | -42.59 | 50.00 | – |
| 0 | 0 | 0 | 0 | 0 | 0 | 0 | 0 | 0 | 0 | 0 | 0 | 0 | 0 | 0 | 0 | 0 | 0 | 0 | 0 | 0 | 0 | 0 | 0 | 0 | 15 | 34 | -1 | -23 | -1 | 0 |
| 0 | 0 | 0 | 0 | -1 | 0 | 0 | 0 | -1 | 0 | -1 | 0 | -1 | -1 | 0 | -1 | -1 | -1 | -2 | 0 | -1 | -3 | -4 | -4 | -9 | 10 | 20 | -167 | -39 | -17 | -6 |
| – | – | – | – | – | – | – | – | – | – | – | – | – | – | – | – | – | – | 100.00 | – | – | 200.00 | 33.33 | – | 125.00 | -211.11 | 100.00 | -935.00 | -76.65 | -56.41 | -64.71 |
| 0.05 | 0.05 | 0.05 | 0.05 | 0.06 | 0.07 | 0.1 | 0.13 | 0.15 | 0.17 | 0.22 | 0.31 | 0.37 | 0.44 | 0.54 | 0.64 | 0.69 | 0.79 | 0.82 | 0.99 | 1.13 | 1.49 | 1.67 | 1.78 | 1.78 | 1.85 | 1.85 | 2.05 | 2.14 | 2.09 | 2.2 |
Details
Keystats
ⓘRevenue and Growth
The Core Lithium Revenue and Revenue Growth are pivotal to understanding the company's financial health and operational efficiency. A consistent increase in revenue indicates a company’s ability to effectively market and sell its products or services, while the revenue growth percentage offers insights into the pace at which the company is expanding over the years.
Gross Margin
The Gross Margin is a crucial metric that showcases the percentage of revenue exceeding the cost of goods sold (COGS). A higher gross margin is indicative of a company’s efficiency in controlling its production costs, thereby promising potential profitability and financial stability.
EBIT and EBIT Margin
EBIT (Earnings Before Interest and Taxes) and EBIT Margin offer deep insights into a company’s profitability, excluding the impacts of interest and taxes. Investors often assess these metrics to gauge the operational efficiency and inherent profitability of a business, separate from its financial structure and tax environment.
Income and Growth
Net Income and its subsequent growth are quintessential for investors looking to understand a company’s profitability. Consistent income growth underscores a company’s ability to enhance its profitability over time, reflecting operational efficiency, strategic competitiveness, and financial health.
Shares Outstanding
Shares outstanding refer to the total number of shares a company has issued. It's instrumental in calculating key metrics like Earnings Per Share (EPS) which is pivotal for investors to evaluate a company’s profitability on a per-share basis, offering a more granular view of financial health and valuation.
Interpreting Year to Year Comparison
Comparing yearly data allows investors to identify trends, assess the company’s growth, and anticipate potential future performance. Analyzing how metrics like revenue, income, and margins change year over year can provide valuable insights into the company’s operational efficiency, competitiveness, and overall financial health.
Expectations and Predictions
Investors often juxtapose the current and past financial data with the market’s expectations. This comparison aids in assessing whether the Core Lithium is performing as anticipated, underperforming or outperforming the market predictions, providing pivotal data for investment decisions.
Core Lithium stock margins
3 Years
5 Years
10 Years
25 Years
Max
Details
Core Lithium Stock Sales Revenue, EBIT, Earnings per Share
3 Years
5 Years
10 Years
25 Years
Max
Details
Core Lithium business model
Core Lithium SWOT Analysis
Strengths
Core Lithium Ltd has several strengths that contribute to its favorable position:
- Experience: The company possesses a team with extensive knowledge and expertise in the lithium mining industry.
- Resource quality: Core Lithium owns high-quality lithium deposits, ensuring a reliable supply of lithium, a key element in the growing electric vehicle (EV) industry.
- Strategic partnerships: The company has established partnerships with industry leaders, providing access to valuable resources and technology.
- Financial stability: Core Lithium has a solid financial standing, allowing for significant investments in exploration, development, and expansion activities.
Weaknesses
Despite its strengths, Core Lithium faces certain weaknesses that may impede its progress:
- Market dependence: The company relies heavily on the demand for lithium in the EV market, making it vulnerable to fluctuations in this specific industry.
- Limited production capacity: Core Lithium currently has limited infrastructure and production capacity, resulting in potential delays in meeting market demand.
- Regulatory challenges: The company operates in a heavily regulated industry, facing potential delays or limitations due to environmental and mining regulations.
Opportunities
Core Lithium can capitalize on several opportunities to enhance its position in the market:
- Growing demand for lithium: The increasing adoption of EVs worldwide presents a significant opportunity for Core Lithium to expand its customer base and increase sales.
- Emerging markets: The company can explore emerging markets where lithium demand is rising, such as energy storage systems and renewable energy technologies.
- Technological advancements: Advancements in lithium extraction and battery technologies offer the potential for improved operational efficiency and cost reduction.
Threats
Core Lithium faces several threats that may impact its growth and profitability:
- Competition: The lithium mining industry is highly competitive, with multiple established players competing for market share.
- Volatility in commodity prices: Fluctuations in lithium prices can directly affect the company's profitability and financial performance.
- Supply chain risks: Core Lithium relies on a complex global supply chain, including transportation and logistics, which may be vulnerable to disruptions or delays.
- Geopolitical factors: Political instability or changes in government policies in countries where lithium deposits are located can introduce uncertainties and impact Core Lithium's operations.
Core Lithium Eulerpool Fair Value
Details
Fair Value
ⓘUnderstanding Fair Value
The fair value of a stock provides insights into whether the stock is currently undervalued or overvalued. It is calculated based on profit, revenue, or dividends and offers a comprehensive perspective of the stock’s intrinsic value.
Income-Based Fair Value
This is calculated by multiplying the earnings per share by the average P/E ratio of the selected past years for smoothing. If the fair value is higher than the current market price, it suggests that the stock is undervalued.
Example 2022
Fair Value Profit 2022 = Earnings per Share 2022 / Average P/E Ratio 2019 - 2021 (3 Years Smoothing)
Revenue-Based Fair Value
It is derived by multiplying the revenue per share by the average price-to-sales ratio of the selected past years for smoothing. An undervalued stock is identified if the fair value exceeds the ongoing market price.
Example 2022
Fair Value Revenue 2022 = Revenue per Share 2022 / Average PSR 2019 - 2021 (3 Years Smoothing)
Dividend-Based Fair Value
This value is determined by dividing the dividend per share by the average dividend yield of the selected past years for smoothing. A higher fair value than the market price indicates an undervalued stock.
Example 2022
Fair Value Dividend 2022 = Dividend per Share 2022 * Average Dividend Yield 2019 - 2021 (3 Years Smoothing)
Expectations and Forecasts
Future expectations provide potential trajectories for stock prices and aid investors in decision-making. The expected values are forecasted figures of fair value, taking into account the growth or decline trends of profit, revenue, or dividend.
Comparative Analysis
Comparing the fair value based on profit, revenue, and dividend provides a holistic overview of the stock’s financial health. Observing the annual and per-annual variations contributes to understanding the consistency and reliability of stock performance.
Core Lithium historical P/E ratio, EBIT multiple, and P/S ratio
Details
Historical valuation
ⓘHistorical Price Earnings Ratio (P/E)
The Historical Price Earnings Ratio (P/E) is a key metric that illustrates the relationship between a Core Lithium's share price and its earnings per share (EPS). It helps investors understand how much they are paying for a company’s earning capacity. A lower P/E ratio might indicate that the stock is undervalued, while a higher ratio can suggest overvaluation, all else being equal.
Price to Revenue Ratio (P/R)
The Price to Revenue Ratio (P/R) of Core Lithium is calculated by dividing the current stock price by the revenue per share. This ratio offers insights into the value investors are willing to pay for each dollar of revenue generated. It is especially useful for valuing companies that are not yet profitable or have erratic earnings.
Price to EBIT Ratio (P/EBIT)
The Price to EBIT Ratio compares the Core Lithium's market capitalization to its earnings before interest and taxes (EBIT). This ratio provides insights into a company’s profitability and operational efficiency, excluding the impacts of tax and capital structure. It is a valuable tool for comparing companies in the same industry.
Interpretation and Use
These ratios are integral in assessing a company’s valuation and profitability. Investors utilize these metrics to make informed decisions, comparing Core Lithium’s financial performance and market valuation against historical data, industry averages, and competitors. They aid in identifying potential investment opportunities and risks, contributing to a comprehensive investment strategy.
Core Lithium annual returns
Details
Annual Return
ⓘUnderstanding the Rendite Chart
The rendite chart provides a comprehensive view of the annual return on investment for . It is divided into two parts - stock price rendite and dividend rendite, offering insights into the overall performance and profitability of the investment.
Stock Price Rendite
This section represents the annual return due to the appreciation or depreciation of the 's stock price. Analyzing this data can help investors understand the stock’s historical performance and predict future trends.
Dividend Rendite
Dividend rendite showcases the percentage return on investment from dividends paid out by . It is a key indicator for investors looking for income generation in addition to stock price appreciation.
Making Investment Decisions
By evaluating both the stock price and dividend rendite, investors can gain insights into the total return on investment. It aids in making informed decisions, balancing between growth and income investment strategies.
Core Lithium shares outstanding
3 Years
5 Years
10 Years
25 Years
Max
Details
| Δ MOM Price Target | 94.44 % |
| Buy | 71.43 % (5) |
| Hold | 28.57 % (2) |
| Sell | 0 % (0) |
| 12M Price Target | 0.36 |
| Last Price | 0.07 |
| Currency | AUD |
| 12M Return Potential | 389.04 % |
| LTM Return | 0 % |
EESG©
Eulerpool ESG Scorecard© for the Core Lithium stock
EEnvironment
20
Environment
SSocial
20
Social
GGovernance (Corporate Governance)
4
Governance (Corporate Governance)
The Eulerpool ESG Scorecard© is the strictly copyrighted intellectual property of Eulerpool Research Systems. Any unauthorized use, imitation, or infringement will be actively pursued and may lead to significant legal consequences. For licenses, collaborations, or usage rights, please contact us directly via our contact form. Contact Form to us.
Core Lithium shareholders
| % | Name |
|---|---|
2.89490% | |
2.51464% | |
1.22384% | |
0.86909% | |
0.58199% | |
0.45011% | |
0.39345% | |
0.38548% | |
0.38287% | |
0.34202% |
Core Lithium Executives and Management Board
Mr. Paul Brown
Chief Executive Officer
Mr. James Bruce
Chief Operational Officer
Mr. James Virgo
Chief Financial Officer
Mr. Gregory English
Non-Executive Independent Chairman of the Board
Mr. Jaroslaw Kopias
Company Secretary
Core Lithium Supply Chain
Correlation: how closely stock prices move together
| Name | 1M | 3M | 6M | 1Y | 2Y |
|---|---|---|---|---|---|
Cardno Supplier | 0,51 | -0,37 | -0,55 | -0,61 | -0,03 |
Qube Holdings Supplier | 0,66 | 0,55 | -0,41 | -0,32 | 0,35 |
Verisk Analytics Supplier | 0,54 | 0,88 | -0,20 | 0,38 | 0,52 |
VDM Group Supplier | 0,26 | 0,00 | -0,25 | — | — |
NRW Supplier | 0,37 | 0,19 | 0,73 | 0,71 | -0,17 |
Metso Outotec Supplier | 0,29 | -0,23 | -0,66 | -0,60 | 0,31 |
Sichuan Yahua Industrial A Supplier | 0,43 | -0,05 | 0,10 | 0,16 | 0,68 |
Natixis Supplier | -0,05 | -0,80 | 0,26 | 0,78 | — |
Ganfeng Lithium H | 0,17 | -0,68 | -0,78 | -0,50 | 0,47 |
Core Lithium Research
SoonDeep-dive analyses, investment theses, and proprietary research — curated by Eulerpool.
Research reports are coming soon
We're building institutional-grade equity research for Core Lithium and thousands of other companies.
Most common questions regarding Core Lithium
The business model of Core Lithium Ltd is focused on the exploration and development of lithium projects. Core Lithium aims to become a reliable supplier of lithium, a key component in the rapidly growing battery industry. The company is committed to identifying and acquiring prospective lithium deposits, conducting thorough exploration activities, and advancing the projects through feasibility studies and development. Through its strategic partnerships and collaborations, Core Lithium strives to optimize its mining operations, efficiently extract lithium resources, and deliver high-quality products to meet the increasing demand for clean energy and electric vehicles worldwide.
Core Lithium stock
Core Lithium Peer Group
Core Lithium Ticker
Core Lithium FIGI
All fundamentals about Core Lithium
Our stock analysis for Core Lithium Revenue stock includes important financial indicators such as revenue, profit, P/E ratio, P/S ratio, EBIT, as well as information on dividends. We also assess aspects such as stocks, market capitalization, debt, equity, and liabilities of Core Lithium Revenue. If you are looking for more detailed information on these topics, we offer comprehensive analyses on our subpages.
- Core Lithium Revenue
- Core Lithium Net Income
- Core Lithium P/E
- Core Lithium P/S
- Core Lithium EBIT
- Core Lithium Dividend
- Core Lithium Directors Dealings
- Core Lithium Stocks
- Core Lithium Market capitalization
- Core Lithium Debt
- Core Lithium Liabilities
- Core Lithium Equity
- Core Lithium AAQS
- Core Lithium Employees
- Core Lithium ROE
- Core Lithium ROA
- Core Lithium ROCE