K&S Corporation (KSC.AX) Stock Price
Price
K&S Corporation stock price
Details
Stock Price
ⓘHow to Read This Chart
This chart tracks the historical stock price of K&S Corporation over time. You can switch between daily, weekly, and monthly views and select custom time ranges — from a single day to the full available history. Use the toggle to view price changes in absolute currency terms or as a percentage change relative to the starting date.
Total Return vs. Price Return
The "Total Return" toggle includes reinvested dividends on top of the pure price movement. This is critical because dividends can account for a significant portion of long-term returns. Historically, roughly 40 % of the S&P 500's total return has come from dividends. Always compare total return when evaluating a stock's real performance against a benchmark.
Intraday Price Data
When viewing a one-day time frame, the chart displays real-time intraday price movements. This is useful for observing how K&S Corporation stock reacts to market openings, earnings releases, or breaking news throughout the trading session.
What to Look For
Look for long-term trends (sustained upward or downward movements over months and years), support and resistance levels (price zones where the stock repeatedly bounces or reverses), and volatility (how much the price fluctuates day to day). Comparing K&S Corporation's price chart to a market index like the S&P 500 can reveal whether the stock is outperforming or underperforming the broader market.
| Date | K&S Corporation Price |
|---|---|
| 2/19/2026 | 3.40 AUD |
| 2/17/2026 | 3.48 AUD |
| 2/16/2026 | 3.48 AUD |
| 2/13/2026 | 3.39 AUD |
| 2/12/2026 | 3.38 AUD |
| 2/11/2026 | 3.39 AUD |
| 2/10/2026 | 3.40 AUD |
| 2/6/2026 | 3.48 AUD |
| 2/3/2026 | 3.49 AUD |
| 2/2/2026 | 3.45 AUD |
| 1/30/2026 | 3.40 AUD |
| 1/29/2026 | 3.40 AUD |
| 1/28/2026 | 3.40 AUD |
| 1/27/2026 | 3.40 AUD |
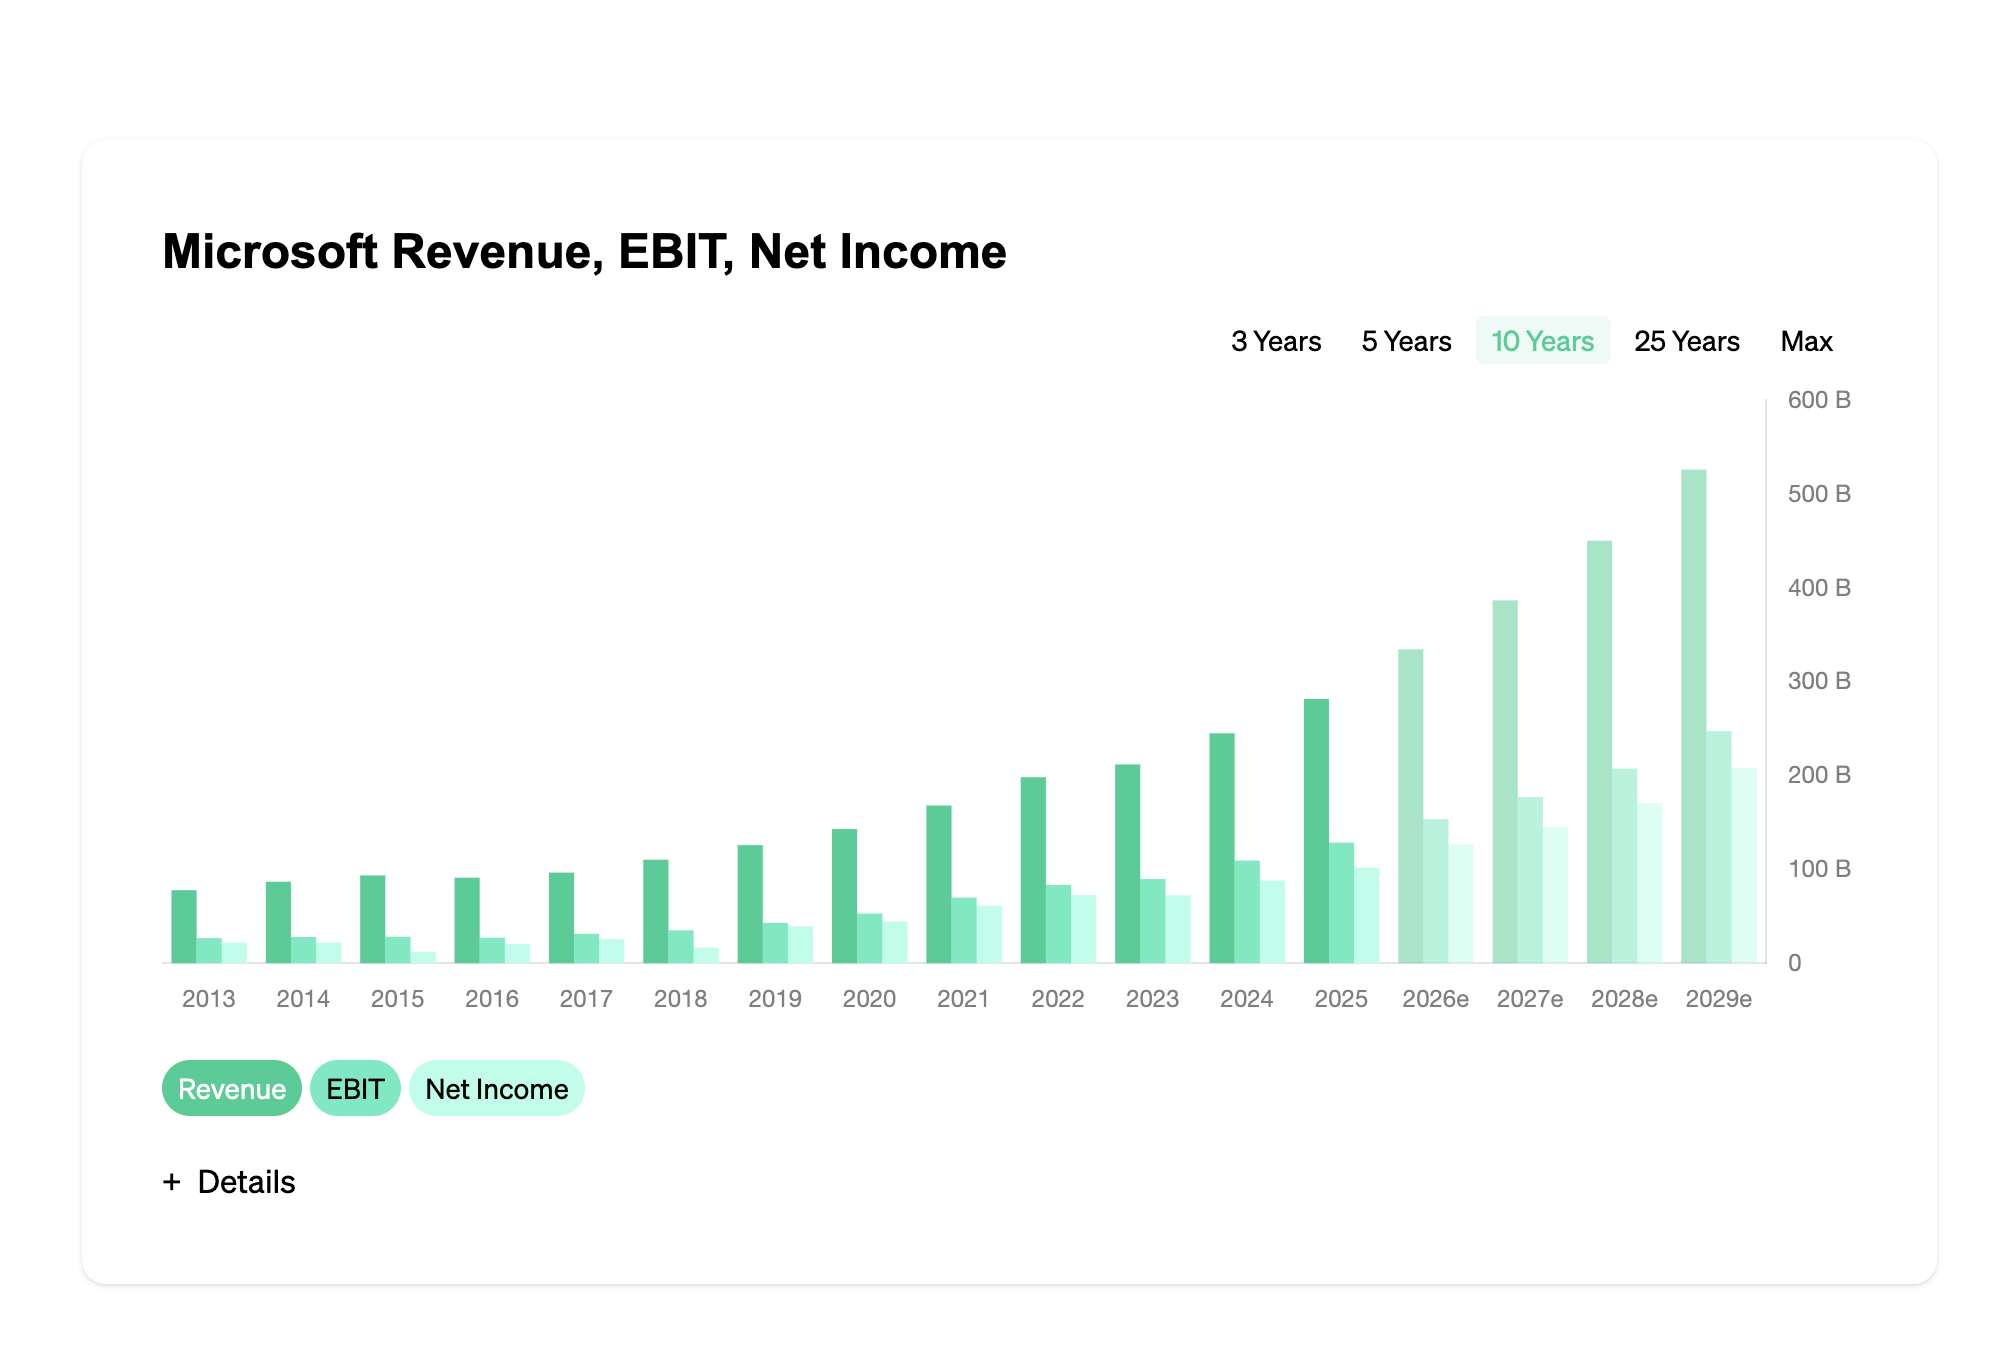
K&S Corporation Revenue, EBIT, Net Income
3 Years
5 Years
10 Years
25 Years
Max
Details
K&S Corporation Income Statement, Balance Sheet, Cash Flow Statement
| REVENUE (M AUD) |
|---|
| REVENUE GROWTH (%) |
| GROSS MARGIN (%) |
| GROSS INCOME (M AUD) |
| NET INCOME (M AUD) |
| NET INCOME GROWTH (%) |
| DIVIDEND (AUD)DIV. (AUD) |
| DIVIDEND GROWTH (%)DIV. GROWTH (%) |
| SHARES (M) |
| DOCUMENTS |
| 2001 | 2002 | 2003 | 2004 | 2005 | 2006 | 2007 | 2008 | 2009 | 2010 | 2011 | 2012 | 2013 | 2014 | 2015 | 2016 | 2017 | 2018 | 2019 | 2020 | 2021 | 2022 | 2023 | 2024 | 2025 |
|---|---|---|---|---|---|---|---|---|---|---|---|---|---|---|---|---|---|---|---|---|---|---|---|---|
| 229 | 271 | 300 | 300 | 353 | 367 | 418 | 466 | 441 | 454 | 523 | 554 | 564 | 586 | 699 | 688 | 755 | 844 | 905 | 790 | 688 | 776 | 848 | 824 | 744 |
| – | 18.34 | 10.70 | – | 17.67 | 3.97 | 13.90 | 11.48 | -5.36 | 2.95 | 15.20 | 5.93 | 1.81 | 3.90 | 19.28 | -1.57 | 9.74 | 11.79 | 7.23 | -12.71 | -12.91 | 12.79 | 9.28 | -2.83 | -9.71 |
| 69.00 | 72.69 | 73.00 | 73.67 | 72.80 | 69.21 | 71.29 | 69.10 | 67.12 | 71.81 | 71.51 | 71.84 | 72.70 | 68.94 | 71.10 | 71.37 | 69.93 | 69.08 | 67.07 | 67.22 | 70.20 | 63.66 | 62.50 | 62.74 | 63.17 |
| 158 | 197 | 219 | 221 | 257 | 254 | 298 | 322 | 296 | 326 | 374 | 398 | 410 | 404 | 497 | 491 | 528 | 583 | 607 | 531 | 483 | 494 | 530 | 517 | 470 |
| 6 | -5 | 11 | 12 | 19 | 18 | 17 | 19 | 18 | 18 | 14 | 16 | 15 | 8 | 13 | -104 | 6 | 17 | 2 | 11 | 18 | 17 | 28 | 31 | 29 |
| – | -183.33 | -320.00 | 9.09 | 58.33 | -5.26 | -5.56 | 11.76 | -5.26 | – | -22.22 | 14.29 | -6.25 | -46.67 | 62.50 | -900.00 | -105.77 | 183.33 | -88.24 | 450.00 | 63.64 | -5.56 | 64.71 | 10.71 | -6.45 |
| - | - | - | - | - | 0.20 | 0.20 | 0.21 | 0.21 | 0.17 | 0.17 | 0.14 | 0.18 | 0.11 | 0.09 | 0.07 | 0.04 | 0.06 | 0.06 | 0.06 | 0.09 | 0.11 | 0.21 | 0.26 | 0.23 |
| – | – | – | – | – | – | – | 5.00 | – | -19.05 | – | -17.65 | 28.57 | -38.89 | -18.18 | -22.22 | -42.86 | 50.00 | – | – | 50.00 | 22.22 | 90.91 | 23.81 | -11.54 |
| 60 | 61.5 | 61.5 | 61.2 | 61.2 | 67.3 | 68.6 | 70.2 | 71 | 72.1 | 80.8 | 87.7 | 90.3 | 98.3 | 116.84 | 119.68 | 121.41 | 123.16 | 125.76 | 127.65 | 128.79 | 129.96 | 135.16 | 136.85 | 136.85 |
| – | – | – | – | – | – | – | – | – | – | – | – | – | – | – | – | – | – | – | – | – | – | – | – | – |
Details
Income Statement Key Figures
ⓘRevenue and Revenue Growth
Revenue is the starting point of every income statement — it measures the total sales K&S Corporation generates from its core business. Revenue growth (expressed as year-over-year percentage change) is one of the most important indicators of business momentum. Sustained growth above 10 % annually is generally considered strong, while declining revenue is a serious warning sign that demands investigation.
Gross Margin
Gross margin = (Revenue − Cost of Goods Sold) ÷ Revenue. It reveals what percentage of each dollar of revenue K&S Corporation retains after direct production costs. High gross margins (above 50 %) are typical of asset-light businesses like software and brands, while capital-intensive industries like manufacturing often operate below 30 %. Compare K&S Corporation's gross margin to industry peers and track it over time to spot improving or deteriorating pricing power.
EBIT and EBIT Margin
EBIT measures operating profit — what remains after subtracting all operating expenses (including R&D, sales, and administrative costs) from gross profit. The EBIT margin shows this as a percentage of revenue. Because it excludes interest and taxes, EBIT allows fair comparisons between companies with different debt levels and tax jurisdictions. A rising EBIT margin indicates improving operational efficiency.
Net Income and Earnings Per Share (EPS)
Net income is the company's final profit after all expenses, interest, and taxes. Dividing net income by the number of shares outstanding gives you EPS — the single most influential metric in stock valuation. Consistent EPS growth is the primary driver of long-term stock price appreciation. Always check whether EPS growth comes from genuine profit improvement or from share buybacks reducing the share count.
Shares Outstanding
The total number of shares K&S Corporation has issued. A declining share count (through buybacks) boosts EPS and signals management confidence. A rising share count (through stock issuance) dilutes existing shareholders. Always monitor this number alongside EPS to get the full picture of per-share value creation.
Analyst Estimates
The projected figures represent consensus estimates from professional analysts. Compare these forecasts against K&S Corporation's historical growth rates to assess whether expectations are realistic. A company that consistently beats consensus estimates tends to see its stock price rewarded over time, while repeated misses erode investor confidence.
K&S Corporation Stock Quarterly Figures
| REVENUE (M AUD) |
|---|
| REVENUE GROWTH (%) |
| GROSS MARGIN (%) |
| GROSS INCOME (M AUD) |
| NET INCOME (M AUD) |
| NET INCOME GROWTH (%) |
| DIVIDEND (AUD)DIV. (AUD) |
| DIVIDEND GROWTH (%)DIV. GROWTH (%) |
| SHARES (M) |
| 2000 QNaN | 2001 Q4 | 2002 Q2 | 2002 Q4 | 2003 Q2 | 2003 Q4 | 2004 Q2 | 2004 Q4 | 2005 Q2 | 2005 Q4 | 2006 Q2 | 2006 Q4 | 2007 Q2 | 2007 Q4 | 2008 Q2 | 2008 Q4 | 2009 Q2 | 2009 Q4 | 2010 Q2 | 2010 Q4 | 2011 Q2 | 2011 Q4 | 2012 Q2 | 2012 Q4 | 2013 Q2 | 2013 Q4 | 2014 Q2 | 2014 Q4 | 2015 Q2 | 2015 Q4 | 2016 Q2 | 2016 Q4 | 2017 Q2 | 2017 Q4 | 2018 Q2 | 2018 Q4 | 2019 Q2 | 2019 Q4 | 2020 Q2 | 2020 Q4 | 2021 Q2 | 2021 Q4 | 2022 Q2 | 2022 Q4 | 2023 Q1 | 2023 Q2 | 2023 Q3 | 2023 Q4 | 2024 Q2 | 2024 Q4 | 2025 Q2 | 2025 Q4 |
|---|---|---|---|---|---|---|---|---|---|---|---|---|---|---|---|---|---|---|---|---|---|---|---|---|---|---|---|---|---|---|---|---|---|---|---|---|---|---|---|---|---|---|---|---|---|---|---|---|---|---|---|
| 113 | 115 | 137 | 133 | 157 | 142 | 145 | 154 | 170 | 170 | 183 | 184 | 215 | 203 | 223 | 242 | 248 | 192 | 217 | 237 | 264 | 258 | 271 | 283 | 293 | 271 | 258 | 327 | 360 | 339 | 355 | 333 | 352 | 403 | 417 | 426 | 466 | 433 | 422 | 368 | 341 | 346 | 370 | 405 | 0 | 435 | 204 | 413 | 422 | 401 | 383 | 361 |
| – | 1.77 | 19.13 | -2.92 | 18.05 | -9.55 | 2.11 | 6.21 | 10.39 | – | 7.65 | 0.55 | 16.85 | -5.58 | 9.85 | 8.52 | 2.48 | -22.58 | 13.02 | 9.22 | 11.39 | -2.27 | 5.04 | 4.43 | 3.53 | -7.51 | -4.80 | 26.74 | 10.09 | -5.83 | 4.72 | -6.20 | 5.71 | 14.49 | 3.47 | 2.16 | 9.39 | -7.08 | -2.54 | -12.80 | -7.34 | 1.47 | 6.94 | 9.46 | – | – | -53.10 | 102.45 | 2.18 | -4.98 | -4.49 | -5.74 |
| 85.84 | 53.04 | 73.72 | 54.89 | 73.89 | 72.54 | 73.79 | 74.03 | 72.94 | 70.59 | 69.95 | 68.48 | 71.16 | 70.94 | 71.30 | 67.36 | 67.34 | 67.19 | 72.81 | 70.89 | 73.11 | 69.77 | 71.59 | 71.73 | 73.38 | 71.96 | 69.77 | 68.50 | 70.00 | 72.27 | 71.55 | 71.17 | 70.17 | 69.73 | 69.54 | 68.78 | 67.17 | 67.67 | 66.59 | 67.93 | 70.97 | 69.36 | 66.76 | 60.99 | – | 60.92 | 16.18 | 64.16 | 63.27 | 62.34 | 63.71 | 62.60 |
| 97 | 61 | 101 | 73 | 116 | 103 | 107 | 114 | 124 | 120 | 128 | 126 | 153 | 144 | 159 | 163 | 167 | 129 | 158 | 168 | 193 | 180 | 194 | 203 | 215 | 195 | 180 | 224 | 252 | 245 | 254 | 237 | 247 | 281 | 290 | 293 | 313 | 293 | 281 | 250 | 242 | 240 | 247 | 247 | 0 | 265 | 33 | 265 | 267 | 250 | 244 | 226 |
| 3 | 2 | 4 | -10 | 5 | 6 | 6 | 6 | 8 | 11 | 8 | 9 | 8 | 9 | 9 | 9 | 9 | 8 | 9 | 9 | 8 | 6 | 7 | 9 | 10 | 5 | 5 | 3 | 6 | 6 | -88 | -15 | 4 | 2 | 4 | 12 | 9 | -7 | 2 | 8 | 17 | 0 | 8 | 8 | 7 | 15 | 6 | 13 | 16 | 14 | 16 | 13 |
| – | -33.33 | 100.00 | -350.00 | -150.00 | 20.00 | – | – | 33.33 | 37.50 | -27.27 | 12.50 | -11.11 | 12.50 | – | – | – | -11.11 | 12.50 | – | -11.11 | -25.00 | 16.67 | 28.57 | 11.11 | -50.00 | – | -40.00 | 100.00 | – | -1,566.67 | -82.95 | -126.67 | -50.00 | 100.00 | 200.00 | -25.00 | -177.78 | -128.57 | 300.00 | 112.50 | – | – | – | -12.50 | 114.29 | -60.00 | 116.67 | 23.08 | -12.50 | 14.29 | -18.75 |
| - | 0.02 | - | - | - | - | - | - | - | - | - | - | - | - | - | - | - | - | - | - | - | - | - | - | - | - | - | - | - | - | - | - | - | - | - | - | - | - | - | - | - | - | - | - | 0.07 | - | 0.14 | - | - | - | - | - |
| – | – | – | – | – | – | – | – | – | – | – | – | – | – | – | – | – | – | – | – | – | – | – | – | – | – | – | – | – | – | – | – | – | – | – | – | – | – | – | – | – | – | – | – | – | – | – | – | – | – | – | – |
| 59.5 | 60.6 | 61.5 | 61.5 | 61.5 | 61.5 | 61.5 | 61.2 | 61.2 | 61.2 | 67.3 | 67.8 | 68.2 | 69.1 | 70.4 | 70.1 | 70.5 | 71.5 | 69.8 | 70.7 | 74.4 | 87.3 | 86.6 | 88.8 | 89.6 | 91 | 91 | 105.6 | 109.1 | 124.6 | 120.5 | 118.9 | 121.7 | 121.1 | 121.84 | 124.48 | 125.3 | 126.22 | 126.04 | 129.25 | 126.1 | 129.17 | 132.41 | 127.52 | 0 | 125.85 | 144.46 | 144.46 | 133.9 | 139.79 | 141.16 | 132.54 |
Details
Income Statement Key Figures
ⓘRevenue and Revenue Growth
Revenue is the starting point of every income statement — it measures the total sales K&S Corporation generates from its core business. Revenue growth (expressed as year-over-year percentage change) is one of the most important indicators of business momentum. Sustained growth above 10 % annually is generally considered strong, while declining revenue is a serious warning sign that demands investigation.
Gross Margin
Gross margin = (Revenue − Cost of Goods Sold) ÷ Revenue. It reveals what percentage of each dollar of revenue K&S Corporation retains after direct production costs. High gross margins (above 50 %) are typical of asset-light businesses like software and brands, while capital-intensive industries like manufacturing often operate below 30 %. Compare K&S Corporation's gross margin to industry peers and track it over time to spot improving or deteriorating pricing power.
EBIT and EBIT Margin
EBIT measures operating profit — what remains after subtracting all operating expenses (including R&D, sales, and administrative costs) from gross profit. The EBIT margin shows this as a percentage of revenue. Because it excludes interest and taxes, EBIT allows fair comparisons between companies with different debt levels and tax jurisdictions. A rising EBIT margin indicates improving operational efficiency.
Net Income and Earnings Per Share (EPS)
Net income is the company's final profit after all expenses, interest, and taxes. Dividing net income by the number of shares outstanding gives you EPS — the single most influential metric in stock valuation. Consistent EPS growth is the primary driver of long-term stock price appreciation. Always check whether EPS growth comes from genuine profit improvement or from share buybacks reducing the share count.
Shares Outstanding
The total number of shares K&S Corporation has issued. A declining share count (through buybacks) boosts EPS and signals management confidence. A rising share count (through stock issuance) dilutes existing shareholders. Always monitor this number alongside EPS to get the full picture of per-share value creation.
Analyst Estimates
The projected figures represent consensus estimates from professional analysts. Compare these forecasts against K&S Corporation's historical growth rates to assess whether expectations are realistic. A company that consistently beats consensus estimates tends to see its stock price rewarded over time, while repeated misses erode investor confidence.
K&S Corporation stock margins
3 Years
5 Years
10 Years
25 Years
Max
Details
K&S Corporation Stock Sales Revenue, EBIT, Earnings per Share
3 Years
5 Years
10 Years
25 Years
Max
Details
K&S Corporation business model
K&S Corporation SWOT Analysis
Strengths
K&S Corporation Ltd has a strong presence in the transportation industry, with a diversified range of services that includes logistics, freight, and bulk haulage.
The company has a well-established customer base and strong relationships with key clients, allowing for stable revenue streams.
K&S Corporation Ltd has a fleet of modern and well-maintained vehicles, which helps ensure efficient and reliable service to customers.
The company's experienced management team and skilled workforce contribute to its operational excellence and ability to adapt to changing market conditions.
Weaknesses
K&S Corporation Ltd faces intense competition in the transportation industry, which may put pressure on pricing and margins.
The company's heavy reliance on fuel prices can impact its profitability, as fluctuations in fuel costs can significantly affect operating expenses.
K&S Corporation Ltd's operations are primarily concentrated in Australia, which exposes the company to risks associated with a single geographic market.
Opportunities
There is potential for K&S Corporation Ltd to expand its international operations and tap into new markets, which could diversify its revenue streams and reduce dependency on the Australian market.
Rapid advancements in technology present opportunities for the company to invest in innovative solutions, such as GPS tracking and supply chain optimization systems, to enhance efficiency and customer satisfaction.
Increasing focus on sustainability and green logistics opens avenues for K&S Corporation Ltd to adopt eco-friendly practices, which can attract environmentally-conscious customers and improve brand perception.
Threats
Economic downturns and market volatility pose threats to K&S Corporation Ltd's profitability and financial stability, as they can lead to reduced demand for transportation services.
Strict regulations and compliance requirements in the transportation industry can create challenges for the company, as non-compliance may result in penalties and reputational damage.
Emerging technologies and disruptive business models in the transportation sector could pose a threat to K&S Corporation Ltd's traditional business operations if the company fails to adapt and innovate accordingly.
K&S Corporation Eulerpool Fair Value
Details
Fair Value Estimate
ⓘWhat Is Fair Value?
Fair value is an estimate of what a stock is truly "worth" based on its financial fundamentals, independent of the current market price. If the calculated fair value is above the current share price, the stock may be undervalued — and vice versa. This chart shows three different fair value approaches so you can cross-check them against each other.
Earnings-Based Fair Value
Calculated by multiplying the current earnings per share (EPS) by the average historical P/E ratio over a selected multi-year period. The smoothing over several years filters out temporary spikes or dips. If this fair value exceeds the market price, it suggests the stock is cheap relative to its earning power.
Example: Fair Value (Earnings) 2022 = EPS 2022 × Average P/E 2019–2021
Revenue-Based Fair Value
Derived by multiplying revenue per share by the average historical price-to-sales ratio. This method is particularly useful for companies with volatile or temporarily depressed earnings, as revenue tends to be more stable than profits. It answers: "At what price has the market historically valued each dollar of this company's sales?"
Example: Fair Value (Revenue) 2022 = Revenue per Share 2022 × Average P/S 2019–2021
Dividend-Based Fair Value
Calculated by dividing the dividend per share by the average historical dividend yield. This approach is most relevant for mature, consistently dividend-paying companies. If the resulting fair value is higher than the current price, it implies the stock offers a better yield than its historical average.
Example: Fair Value (Dividend) 2022 = Dividend per Share 2022 ÷ Average Yield 2019–2021
How to Use This Chart
When all three fair value lines converge above the current price, it strengthens the case that the stock is undervalued. When they diverge, investigate why — it may indicate a structural shift in margins, payout policy, or growth rate. The forward estimates on the right extend the analysis using projected fundamentals, helping you assess whether the current price already reflects future growth expectations.
K&S Corporation historical P/E ratio, EBIT multiple, and P/S ratio
Details
Historical Valuation Multiples
ⓘPrice-to-Earnings Ratio (P/E)
The P/E ratio divides K&S Corporation's share price by its earnings per share. It tells you how many years of current earnings you are "paying for" when you buy the stock. A P/E of 20 means you pay $20 for every $1 of annual earnings. The S&P 500 historically trades at an average P/E of roughly 15–17. A P/E significantly above that may signal high growth expectations; one below may indicate undervaluation — or declining business quality.
Price-to-Sales Ratio (P/S)
The P/S ratio divides market capitalization by total revenue. Unlike the P/E ratio, it works even for companies that are not yet profitable, making it essential for evaluating high-growth firms. A P/S below 1.0 may indicate undervaluation, while ratios above 10 are typically reserved for fast-growing tech or SaaS companies with high expected future margins.
Price-to-EBIT Ratio
This ratio relates K&S Corporation's market price to its operating earnings, excluding the effects of debt structure and tax jurisdiction. It is particularly useful for comparing companies across different countries or with different levels of leverage, because it focuses purely on operational profitability. Lower values suggest cheaper operational earnings.
How to Use This Chart
This chart plots K&S Corporation's valuation multiples over time. Compare the current P/E, P/S, and P/EBIT to their own historical averages — if the current ratio is well below the multi-year average, the stock may be relatively cheap compared to its own track record. Combine this with industry comparisons: a P/E that looks high in absolute terms may be justified if K&S Corporation grows earnings faster than its peers.
K&S Corporation annual returns
Details
Annual Return
ⓘWhat This Chart Shows
This chart breaks down 's total annual return into two components: price return (gains or losses from stock price movement) and dividend return (income received from dividend payments). Together, they represent the total return an investor would have earned in each calendar year.
Price Return
Price return measures the percentage change in 's stock price from January 1st to December 31st of each year. Positive bars indicate the stock appreciated; negative bars show a decline. This is the component most investors focus on, but it tells only part of the story — especially for dividend-paying stocks.
Dividend Return
Dividend return represents the income generated from dividends paid during the year, expressed as a percentage of the starting stock price. While it may seem small in any single year (typically 1–4 % for established companies), dividends compound significantly over decades and have historically contributed roughly 40 % of total stock market returns.
What to Look For
Examine how many years showed positive vs. negative returns to gauge consistency. A stock with mostly positive years and small drawdowns suggests lower risk. Also compare 's annual returns to a benchmark index — consistently outperforming the market is a hallmark of a strong investment. Pay attention to the worst years: understanding downside risk is just as important as chasing upside potential.
K&S Corporation shares outstanding
3 Years
5 Years
10 Years
25 Years
Max
Details
K&S Corporation stock splits
K&S Corporation Dividend History
36 years of dividend payments
K&S Corporation dividend history and estimates
3 Years
5 Years
10 Years
25 Years
Max
Details
K&S Corporation dividend payout ratio
3 Years
5 Years
10 Years
25 Years
Max
Details
K&S Corporation Earnings Estimates
| Date | EPS estimate | Revenue Estimate | Quarterly report |
|---|---|---|---|
| 2/21/2017 | 0.04AUD | 369.46 MAUD | 2017 Q2 |
| 2/25/2015 | 7.07AUD | 361.34 MAUD | 2015 Q2 |
K&S Corporation shareholders
| % | Name |
|---|---|
64.56851% | |
14.18871% | |
1.98759% | |
1.66823% | |
1.01512% | |
0.51300% | |
0.51151% | |
0.51054% | |
0.41667% | |
0.31056% |
K&S Corporation Executives and Management Board
Mr. Paul Sarant
(55)Chief Executive Officer, Managing Director, Executive Director · since 2007
Mr. Raunak Parikh
Chief Financial Officer
Mr. Christopher Bright
(52)General Counsel, Company Secretary
Mr. Anthony Johnson
Non-Executive Chairman of the Board
Mr. Legh Winser
(75)Non-Executive Director · since 1998
K&S Corporation Supply Chain
Correlation: how closely stock prices move together
| # | Name | 1M | 3M | 6M | 1Y | 2Y | Trend |
|---|---|---|---|---|---|---|---|
| 1 | 0,08 | 0,29 | 0,13 | -0,09 | — | ||
| 2 | 0,58 | 0,23 | 0,09 | -0,53 | — | ||
| 3 | -0,17 | -0,30 | 0,00 | -0,58 | — | ||
| 4 | 0,59 | 0,53 | 0,42 | -0,37 | — | ||
| 5 | 0,04 | 0,37 | 0,09 | 0,51 | — |
K&S Corporation Research
SoonDeep-dive analyses, investment theses, and proprietary research — curated by Eulerpool.
Research reports are coming soon
We're building institutional-grade equity research for K&S Corporation and thousands of other companies.
Most common questions regarding K&S Corporation
The business model of K&S Corporation Ltd is centered around providing integrated logistics and distribution services. They offer a wide range of transportation solutions, including road freight, rail services, and warehousing. K&S Corporation aims to seamlessly connect customers with their suppliers and end-users through their extensive network and efficient operations. By leveraging their expertise in logistics management and their strong presence in the market, K&S Corporation delivers tailored, cost-effective solutions to meet their clients' needs. As a leading player in the Australian logistics industry, K&S Corporation focuses on delivering exceptional service and maximizing value for their customers.
K&S Corporation stock
K&S Corporation Peer Group
K&S Corporation Ticker
K&S Corporation FIGI
All fundamentals about K&S Corporation
Our stock analysis for K&S Corporation Revenue stock includes important financial indicators such as revenue, profit, P/E ratio, P/S ratio, EBIT, as well as information on dividends. We also assess aspects such as stocks, market capitalization, debt, equity, and liabilities of K&S Corporation Revenue. If you are looking for more detailed information on these topics, we offer comprehensive analyses on our subpages.